Analyze Data with AI
You can use Daytona Sandbox to run AI-generated code to analyze data. Here’s how the AI data analysis workflow typically looks:
- Your user has a dataset in CSV format or other formats.
- You prompt the LLM to generate code (usually Python) based on the user’s data.
- The sandbox runs the AI-generated code and returns the results.
- You display the results to the user.
Build an AI Data Analyst with Daytona
This example shows how to build an AI-powered data analyst that automatically generates insights and visualizations from CSV data using Daytona’s secure sandbox environment.
What we’ll build: A system that analyzes a vehicle valuation dataset, identifies price relation to manufacturing year, and generates professional visualizations - all through natural language prompts to Claude.
1. Project Setup
1.1 Install Dependencies
Install the Daytona SDK and Anthropic SDK to your project:
bash pip install daytona anthropic python-dotenv
bash npm install @daytonaio/sdk @anthropic-ai/sdk dotenv
1.2 Configure Environment
Get your API keys and configure your environment:
- Daytona API key: Get it from Daytona Dashboard
- Anthropic API key: Get it from Anthropic Console
Create a .env file in your project:
DAYTONA_API_KEY=dtn_***ANTHROPIC_API_KEY=sk-ant-***2. Dataset Preparation
2.1 Download Dataset
We’ll be using a publicly available dataset of vehicle valuation. You can download it directly from:
https://download.daytona.io/dataset.csv
Download the file and save it as dataset.csv in your project directory.
2.2 Initialize Sandbox
Now create a Daytona sandbox and upload your dataset:
from dotenv import load_dotenvfrom daytona import Daytonaimport os
load_dotenv()
# Create sandbox
daytona = Daytona()sandbox = daytona.create()
# Upload the dataset to the sandbox
sandbox.fs.upload_file("dataset.csv", "/home/daytona/dataset.csv")
import 'dotenv/config'import { Daytona } from '@daytonaio/sdk';
// Create sandboxconst daytona = new Daytona();const sandbox = await daytona.create()
// Upload the dataset to the sandboxawait sandbox.fs.uploadFile('dataset.csv', '/home/daytona/dataset.csv')3. Building the AI Data Analyst
Now we’ll create the core functionality that connects Claude with Daytona to analyze data and generate visualizations.
3.1 Code Execution Handler
First, let’s create a function to handle code execution and chart extraction:
import base64
def run_ai_generated_code(sandbox, ai_generated_code):  execution = sandbox.process.code_run(ai_generated_code)  if execution.exit_code != 0:    print('AI-generated code had an error.')    print(execution.exit_code)    print(execution.result)    return
  # Check for charts in execution artifacts  if not execution.artifacts or not execution.artifacts.charts:    print('No charts found in execution artifacts')    return
  result_idx = 0  for result in execution.artifacts.charts:    if result.png: # Save the png to a file (png is in base64 format)      with open(f'chart-{result_idx}.png', 'wb') as f:        f.write(base64.b64decode(result.png))        print(f'Chart saved to chart-{result_idx}.png')        result_idx += 1
import fs from 'fs'
async function runAIGeneratedCode(sandbox, aiGeneratedCode: string) { const execution = await sandbox.process.codeRun(aiGeneratedCode) if (execution.exitCode != 0) { console.error('AI-generated code had an error.') console.log(execution.exitCode) console.log(execution.result) return }
// Check for charts in execution artifacts if (!execution.artifacts || !execution.artifacts.charts) { console.log('No charts found in execution artifacts') return }
let resultIdx = 0 for (const result of execution.artifacts.charts) { if (result.png) { // Save the png to a file (png is in base64 format) fs.writeFileSync(`chart-${resultIdx}.png`, result.png, { encoding: 'base64' }) console.log(`Chart saved to chart-${resultIdx}.png`) resultIdx++ } }}3.2 Creating the Analysis Prompt
Next, we’ll create the prompt that tells Claude about our dataset and what analysis we want. This prompt includes:
- Dataset schema and column descriptions
- The specific analysis request (vote average trends over time)
- Instructions for code generation
from anthropic import Anthropic
prompt = f"""I have a CSV file with vehicle valuations saved in the sandbox at /home/daytona/dataset.csv.
Relevant columns:- 'year': integer, the manufacturing year of the vehicle- 'price_in_euro': float, the listed price of the vehicle in Euros
Analyze how price varies by manufacturing year.Drop rows where 'year' or 'price_in_euro' is missing, non-numeric, or an outlier.Create a line chart showing average price per year.Write Python code that analyzes the dataset based on my request and produces right chart accordingly.Finish with a plt.show()"""
anthropic = Anthropic()print('Waiting for the model response...')
import Anthropic from '@anthropic-ai/sdk'
const prompt = `I have a CSV file with vehicle valuations saved in the sandbox at /home/daytona/dataset.csv.
Relevant columns:- 'year': integer, the manufacturing year of the vehicle- 'price_in_euro': float, the listed price of the vehicle in Euros
Analyze how price varies by manufacturing year.Drop rows where 'year' or 'price_in_euro' is missing, non-numeric, or an outlier.Create a line chart showing average price per year.Write Python code that analyzes the dataset based on my request and produces right chart accordingly.Finish with a plt.show()`
const anthropic = new Anthropic({ apiKey: process.env.ANTHROPIC_API_KEY })console.log('Waiting for the model response...')3.3 Tool Calling Setup
Now we’ll connect Claude to our Daytona sandbox using tool calling. This allows Claude to automatically execute the Python code it generates:
msg = anthropic.messages.create( model='claude-3-5-sonnet-20240620', max_tokens=1024, messages=[{'role': 'user', 'content': prompt}], tools=[ { 'name': 'run_python_code', 'description': 'Run Python code', 'input_schema': { 'type': 'object', 'properties': { 'code': { 'type': 'string', 'description': 'The Python code to run', }, }, 'required': ['code'], }, }, ],)const msg = await anthropic.messages.create({ model: 'claude-3-5-sonnet-20240620', max_tokens: 1024, messages: [{ role: 'user', content: prompt }], tools: [ { name: 'run_python_code', description: 'Run Python code', input_schema: { type: 'object', properties: { code: { type: 'string', description: 'The Python code to run', }, }, required: ['code'], }, }, ],})3.4 Response Processing
Finally, we’ll parse Claude’s response and execute any generated code in our Daytona sandbox:
for content_block in msg.content: if content_block.type == 'tool_use': if content_block.name == 'run_python_code': code = content_block.input['code'] print('Will run following code in the Sandbox:\n', code) # Execute the code in the sandbox run_ai_generated_code(sandbox, code)interface CodeRunToolInput { code: string}
for (const contentBlock of msg.content) { if (contentBlock.type === 'tool_use') { if (contentBlock.name === 'run_python_code') { const code = (contentBlock.input as CodeRunToolInput).code console.log('Will run following code in the Sandbox:\n', code) // Execute the code in the sandbox await runAIGeneratedCode(sandbox, code) } }}That’s it! The run_ai_generated_code function we created automatically handles saving charts. When Claude generates a visualization with plt.show(), Daytona captures it as a chart artifact and saves it as a PNG file.
Key advantages of this approach:
- Secure execution: Code runs in isolated Daytona sandboxes
- Automatic artifact capture: Charts, tables, and outputs are automatically extracted
- Error handling: Built-in error detection and logging
- Language agnostic: While we used Python here, Daytona supports multiple languages
4. Running Your Analysis
Now you can run the complete code to see the results.
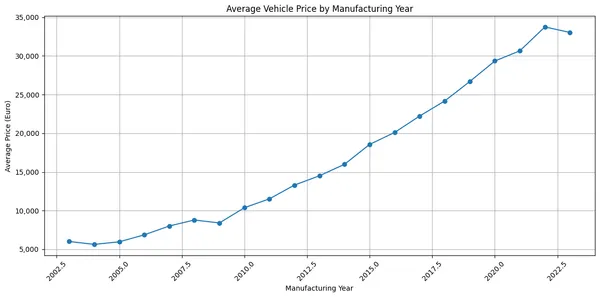
python data-analysis.pynpx tsx data-analysis.tsYou should see the chart in your project directory that will look similar to this:
5. Complete Implementation
Here are the complete, ready-to-run examples:
import base64from dotenv import load_dotenvfrom daytona import Daytona, Sandboxfrom anthropic import Anthropic

def main():    load_dotenv()    # Create sandbox    daytona = Daytona()    sandbox = daytona.create()
    # Upload the dataset to the sandbox    sandbox.fs.upload_file("dataset.csv", "/home/daytona/dataset.csv")
    prompt = f"""I have a CSV file with vehicle valuations saved in the sandbox at /home/daytona/dataset.csv.
Relevant columns:- 'year': integer, the manufacturing year of the vehicle- 'price_in_euro': float, the listed price of the vehicle in Euros
Analyze how price varies by manufacturing year.Drop rows where 'year' or 'price_in_euro' is missing, non-numeric, or an outlier.Create a line chart showing average price per year.Write Python code that analyzes the dataset based on my request and produces right chart accordingly.Finish with a plt.show()"""
    anthropic = Anthropic()    print('Waiting for the model response...')    msg = anthropic.messages.create(        model='claude-3-5-sonnet-20240620',        max_tokens=1024,        messages=[{'role': 'user', 'content': prompt}],        tools=[            {                'name': 'run_python_code',                'description': 'Run Python code',                'input_schema': {                    'type': 'object',                    'properties': {                        'code': {                            'type': 'string',                            'description': 'The Python code to run',                        },                    },                    'required': ['code'],                },            },        ],    )
    for content_block in msg.content:        if content_block.type == 'tool_use':            if content_block.name == 'run_python_code':                code = content_block.input['code']                print('Will run following code in the Sandbox:\n', code)                # Execute the code in the sandbox                run_ai_generated_code(sandbox, code)

def run_ai_generated_code(sandbox: Sandbox, ai_generated_code: str):    execution = sandbox.process.code_run(ai_generated_code)    if execution.exit_code != 0:        print('AI-generated code had an error.')        print(execution.exit_code)        print(execution.result)        return
    # Iterate over all the results and specifically check for png files that will represent the chart.    if not execution.artifacts or not execution.artifacts.charts:        print('No charts found in execution artifacts')        print(execution.artifacts)        return
    result_idx = 0    for result in execution.artifacts.charts:        if result.png:            # Save the png to a file            # The png is in base64 format.            with open(f'chart-{result_idx}.png', 'wb') as f:                f.write(base64.b64decode(result.png))            print(f'Chart saved to chart-{result_idx}.png')            result_idx += 1

if __name__ == "__main__":    main()
import 'dotenv/config'import fs from 'fs'import Anthropic from '@anthropic-ai/sdk'import { Daytona, Sandbox } from '@daytonaio/sdk';
async function main() { // Create sandbox const daytona = new Daytona(); const sandbox = await daytona.create()
// Upload the dataset to the sandbox await sandbox.fs.uploadFile('dataset.csv', '/home/daytona/dataset.csv')
const prompt = `I have a CSV file with vehicle valuations saved in the sandbox at /home/daytona/dataset.csv.
Relevant columns:- 'year': integer, the manufacturing year of the vehicle- 'price_in_euro': float, the listed price of the vehicle in Euros
Analyze how price varies by manufacturing year.Drop rows where 'year' or 'price_in_euro' is missing, non-numeric, or an outlier.Create a line chart showing average price per year.Write Python code that analyzes the dataset based on my request and produces right chart accordingly.Finish with a plt.show()`
const anthropic = new Anthropic({ apiKey: process.env.ANTHROPIC_API_KEY }) console.log('Waiting for the model response...') const msg = await anthropic.messages.create({ model: 'claude-3-5-sonnet-20240620', max_tokens: 1024, messages: [{ role: 'user', content: prompt }], tools: [ { name: 'run_python_code', description: 'Run Python code', input_schema: { type: 'object', properties: { code: { type: 'string', description: 'The Python code to run', }, }, required: ['code'], }, }, ], })
interface CodeRunToolInput { code: string }
for (const contentBlock of msg.content) { if (contentBlock.type === 'tool_use') { if (contentBlock.name === 'run_python_code') { const code = (contentBlock.input as CodeRunToolInput).code console.log('Will run following code in the Sandbox:\n', code) // Execute the code in the sandbox await runAIGeneratedCode(sandbox, code) } } }}
async function runAIGeneratedCode(sandbox: Sandbox, aiGeneratedCode: string) { const execution = await sandbox.process.codeRun(aiGeneratedCode) if (execution.exitCode != 0) { console.error('AI-generated code had an error.') console.log(execution.exitCode) console.log(execution.result) process.exit(1) } // Iterate over all the results and specifically check for png files that will represent the chart. if (!execution.artifacts || !execution.artifacts.charts) { console.log('No charts found in execution artifacts') console.log(execution.artifacts) return }
let resultIdx = 0 for (const result of execution.artifacts.charts) { if (result.png) { // Save the png to a file // The png is in base64 format. fs.writeFileSync(`chart-${resultIdx}.png`, result.png, { encoding: 'base64' }) console.log(`Chart saved to chart-${resultIdx}.png`) resultIdx++ } }}
main().catch(console.error);