AI でデータを分析する
Daytona のサンドボックス(Daytonaが管理する隔離された一時的な実行環境)を使えば、AI が生成したコードでデータを分析できます。一般的な AI によるデータ分析のワークフローは次のとおりです。
- ユーザーは CSV などの形式でデータセットを用意します。
- ユーザーのデータに基づいてコード(通常は Python)を生成するよう、LLM に指示します。
- サンドボックスが AI 生成コードを実行し、結果を返します。
- 結果をユーザーに表示します。
Daytona で AI データアナリストを構築する
この例では、Daytona の安全なサンドボックス環境を用いて、CSV データから自動的に洞察と可視化を生成する AI 搭載のデータアナリストを構築する方法を示します。
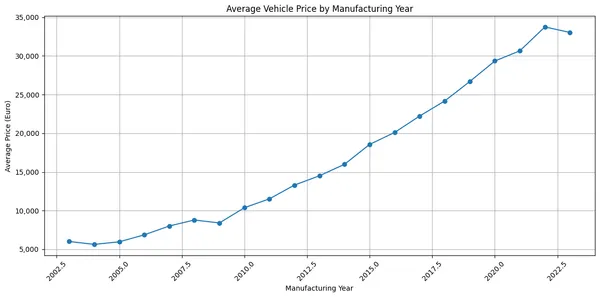
作成するもの: 車両評価データセットを分析し、製造年と価格の関係を特定し、プロフェッショナルな可視化を生成するシステムです。すべて自然言語プロンプトで Claude に指示して実行します。
1. プロジェクトのセットアップ
1.1 依存関係のインストール
Daytona SDK と Anthropic SDK をプロジェクトにインストールします:
bash pip install daytona anthropic python-dotenv
bash npm install @daytonaio/sdk @anthropic-ai/sdk dotenv
1.2 環境設定
APIキーを取得し、環境を設定します:
- Daytona API key: Daytona Dashboard から取得
- Anthropic API key: Anthropic Console から取得
プロジェクトに .env ファイルを作成します:
DAYTONA_API_KEY=dtn_***ANTHROPIC_API_KEY=sk-ant-***2. データセットの準備
2.1 データセットのダウンロード
公開されている車両評価データセットを使用します。以下から直接ダウンロードできます:
https://download.daytona.io/dataset.csv
ファイルをダウンロードし、プロジェクトディレクトリに dataset.csv として保存します。
2.2 サンドボックスの初期化
Daytona のサンドボックスを作成し、データセットをアップロードします:
from dotenv import load_dotenvfrom daytona import Daytonaimport os
load_dotenv()
# Create sandbox
daytona = Daytona()sandbox = daytona.create()
# Upload the dataset to the sandbox
sandbox.fs.upload_file("dataset.csv", "/home/daytona/dataset.csv")
import 'dotenv/config'import { Daytona } from '@daytonaio/sdk';
// Create sandboxconst daytona = new Daytona();const sandbox = await daytona.create()
// Upload the dataset to the sandboxawait sandbox.fs.uploadFile('dataset.csv', '/home/daytona/dataset.csv')3. AI データアナリストの構築
ここでは、Claude と Daytona を連携させてデータを分析し、可視化を生成する中核機能を作成します。
3.1 コード実行ハンドラー
まず、コード実行とチャート抽出を処理する関数を作成します:
import base64
def run_ai_generated_code(sandbox, ai_generated_code):  execution = sandbox.process.code_run(ai_generated_code)  if execution.exit_code != 0:    print('AI-generated code had an error.')    print(execution.exit_code)    print(execution.result)    return
  # Check for charts in execution artifacts  if not execution.artifacts or not execution.artifacts.charts:    print('No charts found in execution artifacts')    return
  result_idx = 0  for result in execution.artifacts.charts:    if result.png: # Save the png to a file (png is in base64 format)      with open(f'chart-{result_idx}.png', 'wb') as f:        f.write(base64.b64decode(result.png))        print(f'Chart saved to chart-{result_idx}.png')        result_idx += 1
import fs from 'fs'
async function runAIGeneratedCode(sandbox, aiGeneratedCode: string) { const execution = await sandbox.process.codeRun(aiGeneratedCode) if (execution.exitCode != 0) { console.error('AI-generated code had an error.') console.log(execution.exitCode) console.log(execution.result) return }
// Check for charts in execution artifacts if (!execution.artifacts || !execution.artifacts.charts) { console.log('No charts found in execution artifacts') return }
let resultIdx = 0 for (const result of execution.artifacts.charts) { if (result.png) { // Save the png to a file (png is in base64 format) fs.writeFileSync(`chart-${resultIdx}.png`, result.png, { encoding: 'base64' }) console.log(`Chart saved to chart-${resultIdx}.png`) resultIdx++ } }}3.2 分析用プロンプトの作成
次に、データセットと求める分析内容をClaudeに伝えるプロンプトを作成します。このプロンプトには以下が含まれます。
- データセットのスキーマと列の説明
- 具体的な分析リクエスト(製造年別の平均価格の推移)
- コード生成に関する指示
from anthropic import Anthropic
prompt = f"""I have a CSV file with vehicle valuations saved in the sandbox at /home/daytona/dataset.csv.
Relevant columns:- 'year': integer, the manufacturing year of the vehicle- 'price_in_euro': float, the listed price of the vehicle in Euros
Analyze how price varies by manufacturing year.Drop rows where 'year' or 'price_in_euro' is missing, non-numeric, or an outlier.Create a line chart showing average price per year.Write Python code that analyzes the dataset based on my request and produces right chart accordingly.Finish with a plt.show()"""
anthropic = Anthropic()print('Waiting for the model response...')
import Anthropic from '@anthropic-ai/sdk'
const prompt = `I have a CSV file with vehicle valuations saved in the sandbox at /home/daytona/dataset.csv.
Relevant columns:- 'year': integer, the manufacturing year of the vehicle- 'price_in_euro': float, the listed price of the vehicle in Euros
Analyze how price varies by manufacturing year.Drop rows where 'year' or 'price_in_euro' is missing, non-numeric, or an outlier.Create a line chart showing average price per year.Write Python code that analyzes the dataset based on my request and produces right chart accordingly.Finish with a plt.show()`
const anthropic = new Anthropic({ apiKey: process.env.ANTHROPIC_API_KEY })console.log('Waiting for the model response...')3.3 ツール呼び出しのセットアップ
ここでは、ツール呼び出しを使用してClaudeをDaytonaのサンドボックスに接続します。これにより、Claudeは生成したPythonコードを自動的に実行できます。
msg = anthropic.messages.create( model='claude-3-5-sonnet-20240620', max_tokens=1024, messages=[{'role': 'user', 'content': prompt}], tools=[ { 'name': 'run_python_code', 'description': 'Run Python code', 'input_schema': { 'type': 'object', 'properties': { 'code': { 'type': 'string', 'description': 'The Python code to run', }, }, 'required': ['code'], }, }, ],)const msg = await anthropic.messages.create({ model: 'claude-3-5-sonnet-20240620', max_tokens: 1024, messages: [{ role: 'user', content: prompt }], tools: [ { name: 'run_python_code', description: 'Run Python code', input_schema: { type: 'object', properties: { code: { type: 'string', description: 'The Python code to run', }, }, required: ['code'], }, }, ],})3.4 レスポンス処理
最後に、Claude のレスポンスを解析し、生成されたコードを Daytona のサンドボックスで実行します:
for content_block in msg.content: if content_block.type == 'tool_use': if content_block.name == 'run_python_code': code = content_block.input['code'] print('Will run following code in the Sandbox:\n', code) # Execute the code in the sandbox run_ai_generated_code(sandbox, code)interface CodeRunToolInput { code: string}
for (const contentBlock of msg.content) { if (contentBlock.type === 'tool_use') { if (contentBlock.name === 'run_python_code') { const code = (contentBlock.input as CodeRunToolInput).code console.log('Will run following code in the Sandbox:\n', code) // Execute the code in the sandbox await runAIGeneratedCode(sandbox, code) } }}以上です。作成した run_ai_generated_code 関数はチャートの保存を自動的に処理します。Claude が plt.show() で可視化を生成すると、Daytona がそれをチャートの成果物として取得し、PNG ファイルとして保存します。
主な利点:
- セキュアな実行: 分離された Daytona のサンドボックスでコードを実行
- 成果物の自動取得: チャート、テーブル、出力を自動的に抽出
- エラーハンドリング: 組み込みのエラー検出とロギング
- 言語非依存: ここでは Python を使用しましたが、Daytona は複数言語をサポート
4. 分析の実行
完全なコードを実行して結果を確認します。
python data-analysis.pynpx tsx data-analysis.tsプロジェクトディレクトリ内に、次のようなチャートが出力されるはずです:
5. 完全な実装
以下に、すぐに実行できるサンプル一式を示します:
import base64from dotenv import load_dotenvfrom daytona import Daytona, Sandboxfrom anthropic import Anthropic

def main():    load_dotenv()    # サンドボックスを作成    daytona = Daytona()    sandbox = daytona.create()
    # データセットをサンドボックスへアップロード    sandbox.fs.upload_file("dataset.csv", "/home/daytona/dataset.csv")
    prompt = f"""/home/daytona/dataset.csv のサンドボックスに、車両の評価額が保存された CSV ファイルがあります。
関連する列:- 'year': 整数型、車両の製造年- 'price_in_euro': 浮動小数点型、車両のユーロ建て掲載価格
製造年ごとの価格変動を分析してください。'year' または 'price_in_euro' が欠損、非数値、または外れ値の行は除外してください。年ごとの平均価格を示す折れ線グラフを作成してください。この要件に基づいてデータセットを分析し、適切なグラフを生成する Python コードを書いてください。最後に plt.show() で終了してください"""
    anthropic = Anthropic()    print('モデルの応答を待機中...')    msg = anthropic.messages.create(        model='claude-3-5-sonnet-20240620',        max_tokens=1024,        messages=[{'role': 'user', 'content': prompt}],        tools=[            {                'name': 'run_python_code',                'description': 'Python コードを実行',                'input_schema': {                    'type': 'object',                    'properties': {                        'code': {                            'type': 'string',                            'description': '実行する Python コード',                        },                    },                    'required': ['code'],                },            },        ],    )
    for content_block in msg.content:        if content_block.type == 'tool_use':            if content_block.name == 'run_python_code':                code = content_block.input['code']                print('サンドボックスで次のコードを実行します:\n', code)                # サンドボックス内でコードを実行                run_ai_generated_code(sandbox, code)

def run_ai_generated_code(sandbox: Sandbox, ai_generated_code: str):    execution = sandbox.process.code_run(ai_generated_code)    if execution.exit_code != 0:        print('AI 生成コードでエラーが発生しました。')        print(execution.exit_code)        print(execution.result)        return
    # すべての結果を走査し、グラフを表す png ファイルがあるか確認    if not execution.artifacts or not execution.artifacts.charts:        print('実行成果物にグラフが見つかりませんでした')        print(execution.artifacts)        return
    result_idx = 0    for result in execution.artifacts.charts:        if result.png:            # png をファイルに保存            # png は base64 形式です。            with open(f'chart-{result_idx}.png', 'wb') as f:                f.write(base64.b64decode(result.png))            print(f'グラフを chart-{result_idx}.png に保存しました')            result_idx += 1

if __name__ == "__main__":    main()
import 'dotenv/config'import fs from 'fs'import Anthropic from '@anthropic-ai/sdk'import { Daytona, Sandbox } from '@daytonaio/sdk';
async function main() { // サンドボックスを作成 const daytona = new Daytona(); const sandbox = await daytona.create()
// データセットをサンドボックスにアップロード await sandbox.fs.uploadFile('dataset.csv', '/home/daytona/dataset.csv')
const prompt = `サンドボックス内の /home/daytona/dataset.csv に車両評価のCSVファイルがあります。
関連列:- 'year': 整数、車両の製造年- 'price_in_euro': 浮動小数点数、ユーロ建ての掲載価格
製造年ごとの価格の変動を分析してください。'year' または 'price_in_euro' が欠損、非数値、または外れ値の行は除外してください。年ごとの平均価格を示す折れ線グラフを作成してください。リクエストに基づいてデータセットを分析し、適切なグラフを生成する Python コードを書いてください。最後に plt.show() で終了してください`
const anthropic = new Anthropic({ apiKey: process.env.ANTHROPIC_API_KEY }) console.log('モデルの応答を待っています...') const msg = await anthropic.messages.create({ model: 'claude-3-5-sonnet-20240620', max_tokens: 1024, messages: [{ role: 'user', content: prompt }], tools: [ { name: 'run_python_code', description: 'Python コードを実行', input_schema: { type: 'object', properties: { code: { type: 'string', description: '実行する Python コード', }, }, required: ['code'], }, }, ], })
interface CodeRunToolInput { code: string }
for (const contentBlock of msg.content) { if (contentBlock.type === 'tool_use') { if (contentBlock.name === 'run_python_code') { const code = (contentBlock.input as CodeRunToolInput).code console.log('サンドボックスで次のコードを実行します:\n', code) // サンドボックスでコードを実行 await runAIGeneratedCode(sandbox, code) } } }}
async function runAIGeneratedCode(sandbox: Sandbox, aiGeneratedCode: string) { const execution = await sandbox.process.codeRun(aiGeneratedCode) if (execution.exitCode != 0) { console.error('AI生成コードでエラーが発生しました。') console.log(execution.exitCode) console.log(execution.result) process.exit(1) } // すべての結果を確認し、グラフを表す PNG ファイルがあるかを特に確認します。 if (!execution.artifacts || !execution.artifacts.charts) { console.log('実行成果物にチャートが見つかりません') console.log(execution.artifacts) return }
let resultIdx = 0 for (const result of execution.artifacts.charts) { if (result.png) { // PNG をファイルに保存 // PNG は base64 形式です。 fs.writeFileSync(`chart-${resultIdx}.png`, result.png, { encoding: 'base64' }) console.log(`チャートを chart-${resultIdx}.png に保存しました`) resultIdx++ } }}
main().catch(console.error);