Imagine you're piloting a complex aircraft without any instruments. You'd be flying blind, unable to gauge your altitude, speed, or fuel levels. This scenario isn't far from the reality of running a software application without proper monitoring and telemetry.
Telemetry is a process that allows teams to collect, record, and transmit data automatically for monitoring and quick performance analysis. Azure Application Insights serves as your cockpit instrumentation, providing crucial data about your application's performance, user behavior, and potential issues.
TL;DR
Instrumenting Go endpoints with Azure Application Insights enhances monitoring and performance analysis.
Importance: Improves performance, security, reliability, scalability, and proactive maintenance.
Setup: Create Application Insights resource, obtain instrumentation key, and integrate SDK.
Benefits: Real-time analytics, custom events, metrics, and seamless development setup with DevContainers.
This article will guide you through the process of instrumenting your Go endpoints with Azure Application Insights, empowering you to make data-driven decisions and keep your application running smoothly.
Importance of Monitoring and Telemetry
Telemetry allows teams to automatically collect, record, and transmit data for monitoring and quick performance analysis. Understanding the importance of monitoring and telemetry is crucial for maintaining a healthy, efficient, and reliable application. Key benefits include:
Ensuring Performance: Continuously track application performance to identify and resolve issues quickly. By monitoring key metrics such as response times, error rates, and resource utilization, you can proactively address performance bottlenecks before they impact users.
Enhancing Security: Detect security threats and vulnerabilities in real-time for prompt mitigation. Telemetry can help identify unusual patterns or suspicious activities, allowing you to respond swiftly to potential security breaches.
Improving Reliability: Provide insights into system health, reducing downtime and increasing reliability. By monitoring the overall health of your application and its dependencies, you can anticipate potential failures and take preventive measures.
Supporting Scalability: Help optimize resources and facilitate seamless scaling. Telemetry data can guide decisions on when and how to scale your application to meet changing demands efficiently.
Enabling Proactive Maintenance: Allow teams to anticipate and address potential issues before they impact users. By analyzing trends and patterns in telemetry data, you can identify areas that require attention or optimization before they become critical problems.
Azure Application Insights Overview
Application Insights, a feature of Azure Monitor, is a service that helps developers keep their applications available, performant, and successful. It provides a comprehensive solution for monitoring and analyzing your application's behavior, performance, and usage patterns.
Key Features
Custom telemetry: Application Insights allows you to define and track custom events and metrics specific to your application's business logic and requirements.
Application performance management (APM): It offers tools to monitor and analyze the performance of your application, including response times, dependency calls, and resource utilization.
Real-time analytics of endpoint performance and dependencies: Get instant insights into how your endpoints are performing and identify any issues with external dependencies.
Benefits
Detect, triage, and diagnose issues faster: With real-time monitoring and alerts, you can quickly identify and resolve problems before they escalate.
Understand user behavior: Gain insights into how users interact with your application, including popular features, user flows, and potential pain points.
Make informed decisions based on data: Use the collected telemetry data to drive data-informed decisions about feature development, performance optimizations, and resource allocation.
Setting Up Application Insights
To get started with Application Insights, follow these steps:
Create an Application Insights Resource in Azure
Log in to the Azure portal
Navigate to "Create a resource"
Search for and select "Application Insights"
Fill in the required details and create the resource
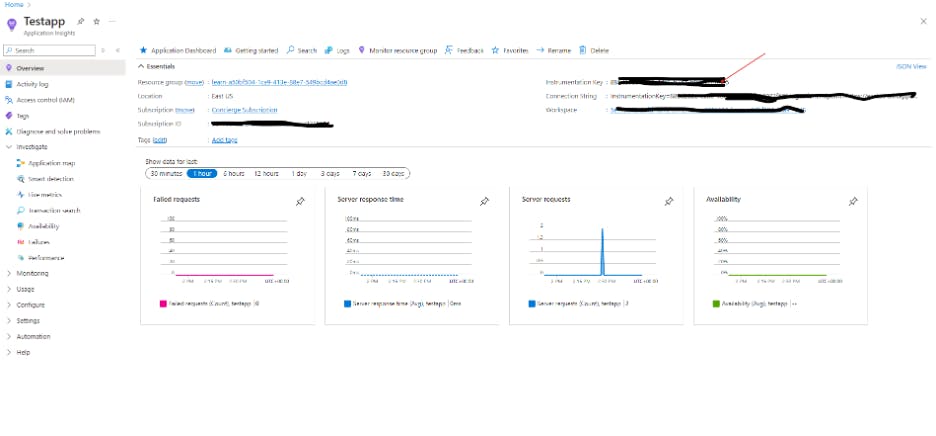
Obtain the Instrumentation Key
Once the resource is created, navigate to its overview page
Look for the "Instrumentation Key" and copy it
This key will be used to connect your application to Application Insights
Instrumenting Your Go Application
Now that we have our Application Insights resource set up, let's instrument our Go application to start sending telemetry data.
Step 1: Import Application Insights into your Go project
First, we need to add the Application Insights SDK to our Go project. Run the following command in your project directory:
1go get github.com/microsoft/ApplicationInsights-Go/appinsights
This command will download and install the Application Insights SDK for Go.
Step 2: Set up a global telemetry client
Next, we'll set up a global telemetry client that will be used to submit all of your telemetry to Application Insights. Here's an example of how to set this up in your main.go file:
1package main23import (4 routes "appinsights/test/router"5 "fmt"6 "os"7 "time"89 "github.com/microsoft/ApplicationInsights-Go/appinsights"10)1112// Setup Application Insights13var telemetryClient = appinsights.NewTelemetryClient(os.Getenv("InstrumentationKey"))1415func main() {16 fmt.Println(telemetryClient)17 r := routes.SetupRouter()1819 // Set role instance name globally20 telemetryClient.Context().Tags.Cloud().SetRole("Student")2122 telemetryClient.TrackTrace("Starting Student API", appinsights.Information)2324 appinsights.NewDiagnosticsMessageListener(func(msg string) error {25 fmt.Printf("[%s] %s\n", time.Now().Format(time.UnixDate), msg)26 return nil27 })2829 r.Run() // listen and serve on 0.0.0.0:8080 (for Windows "localhost:8080")30}
In this setup, we're creating a global telemetryClient using the instrumentation key from our Application Insights resource. We're also setting a role name for our application and tracking the start of our API.
Custom Events and Metrics
Application Insights allows you to track custom events and metrics tailored to your application's specific needs. Let's explore some of the key methods for sending telemetry data:
TrackEvent
Used to log custom events, useful for tracking specific actions or milestones within your application.
1telemetryClient.TrackEvent("UpdateStudent_Success")
This method is particularly useful for tracking business-specific events such as user actions, feature usage, or important process completions. By tracking these events, you can gain insights into how users interact with your application and which features are most popular.
NewRequestTelemetry
Creates a new request telemetry object, representing a single HTTP request to your application. This object can be used to track various details about the request, such as the method, URL, duration, and response code.
1requestTelemetry := appinsights.NewRequestTelemetry("DELETE", c.FullPath(), time.Since(startTime), "404")
Tracking request telemetry is crucial for understanding your application's performance and identifying potential bottlenecks or errors in specific endpoints.
TrackException
Sends information about exceptions or errors that occur in your application to Application Insights.
1if err := providers.UpdateStudent(id, updatedStudent); err != nil {2 telemetryClient.TrackException(err)3 requestTelemetry := appinsights.NewRequestTelemetry("PUT", c.FullPath(), time.Since(startTime), "404")45 requestTelemetry.Properties["UserType"] = c.Request.Header.Get("UserType")6 requestTelemetry.Properties["OS"] = c.Request.Header.Get("User-Agent")78 c.JSON(http.StatusNotFound, gin.H{"message": "Student not found"})9 return10}
By tracking exceptions, you can quickly identify and diagnose issues in your application, leading to faster resolution times and improved reliability.
Diagnostics
Application Insights provides diagnostic capabilities to help troubleshoot problems with telemetry submission. You can enable diagnostics to get more detailed information about the telemetry process.

Real-Time Analytics and Metrics
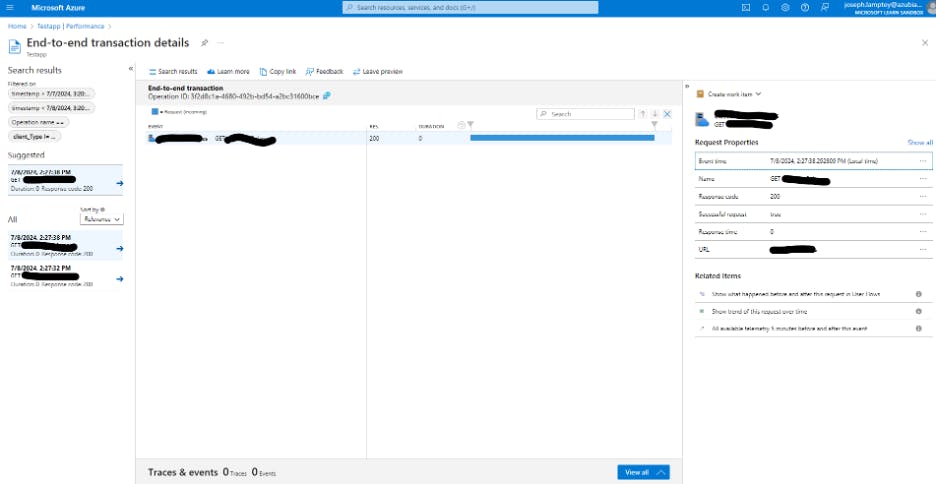
One of the most powerful features of Application Insights is its ability to provide real-time analytics and metrics. These insights help you monitor your application's performance and user behavior as it happens. Some key areas you can monitor in real-time include:
Request rates and response times
Dependency call performance
Exception rates and details
Custom events and metrics
User session information
By leveraging these real-time insights, you can quickly identify and respond to issues, ensuring optimal performance and user experience.
Project Repository
For this article, we've created a sample project that demonstrates how to implement Azure Application Insights in a Go application. You can find the complete source code and additional resources in our GitHub repository:
Go Application Insights Sample Project
This repository contains a fully functional Student API with Application Insights integration. It serves as a practical example of how to implement the concepts discussed in this article.
DevContainer for Easy Setup
To make it easier for developers to get started with this project, we've added a devcontainer configuration. DevContainers are like a secret sauce for development consistency. They encapsulate your project's entire environment - from runtime versions to tool configurations - in a neat, portable package. This will create a containerized development environment with all the necessary tools and dependencies, allowing you to start working on the project immediately.
Our devcontainer.json configuration offers you the flexibility to work in your preferred environment. Whether you choose to leverage Daytona's powerful management capabilities, open it locally in VS Code, spin up a GitHub Codespace, or utilize Daytona Enterprise, you'll enjoy a consistent and streamlined development experience.
Conclusion
Instrumenting your Go endpoints with Azure Application Insights provides valuable insights into your application's performance and user behavior. By following the steps outlined in this article, you can easily integrate Application Insights into your Go applications and start benefiting from its powerful monitoring and analytics capabilities.


